Logging to ElasticSearch (or any other destination)
This guide shows how to configure a Platformatic application to deliver logs to ElasticSearch or via any other supported transports. The logs will then be visualized via Kibana.
Create a platformatic application
Create a platformatic application using npx create-platformatic@latest.
Setup ElasticSearch and Kibana
If you are logging to ElasticSearch and visualizing with Kibana, you might want to set it up using Docker Compose for local testing.
Write the following as docker-compose.yml:
---
version: '3.8'
services:
  elasticsearch:
    image: docker.elastic.co/elasticsearch/elasticsearch:8.3.3
    environment:
      - discovery.type=single-node
      # Elasticsearch 8.x has HTTPS and auth on by default. This option is
      # needed to use HTTP and no auth (as used in the tests).
      - xpack.security.enabled=false
    container_name: elasticsearch
    ports: ['9200:9200']

  kibana:
    image: docker.elastic.co/kibana/kibana:8.3.3
    container_name: kibana
    ports: ['5601:5601']
    depends_on: ['elasticsearch']
Then, start ElasticSearch and Kibana with docker-compose -f docker-compose.yml up.
Install transport
npm i pino-elasticsearch
Configure Logger Transport
Configuring your Platformatic application to log to ElasticSearch is straightforward, you just have to configure it like the following:
{
  ...
  "server": {
    "hostname": "{PLT_SERVER_HOSTNAME}",
    "port": "{PORT}",
    "logger": {
      "level": "{PLT_SERVER_LOGGER_LEVEL}",
      "transport": {
        "targets": [{
          "target": "pino-elasticsearch",
          "options": {
            "node": "http://127.0.0.1:9200"
          }
        }, {
          "target": "pino-pretty"
        }]
      }
    }
  }
}
This snippet can be applied either to the platformatic.runtime.json config
for Platformatic Runtime applications, or as part of the application configuration
for any other application.
This setup will allow you to log both to the terminal (TTY) and to ElasticSearch at the same time.
Start your server with platformatic start, and navigate across
its API.
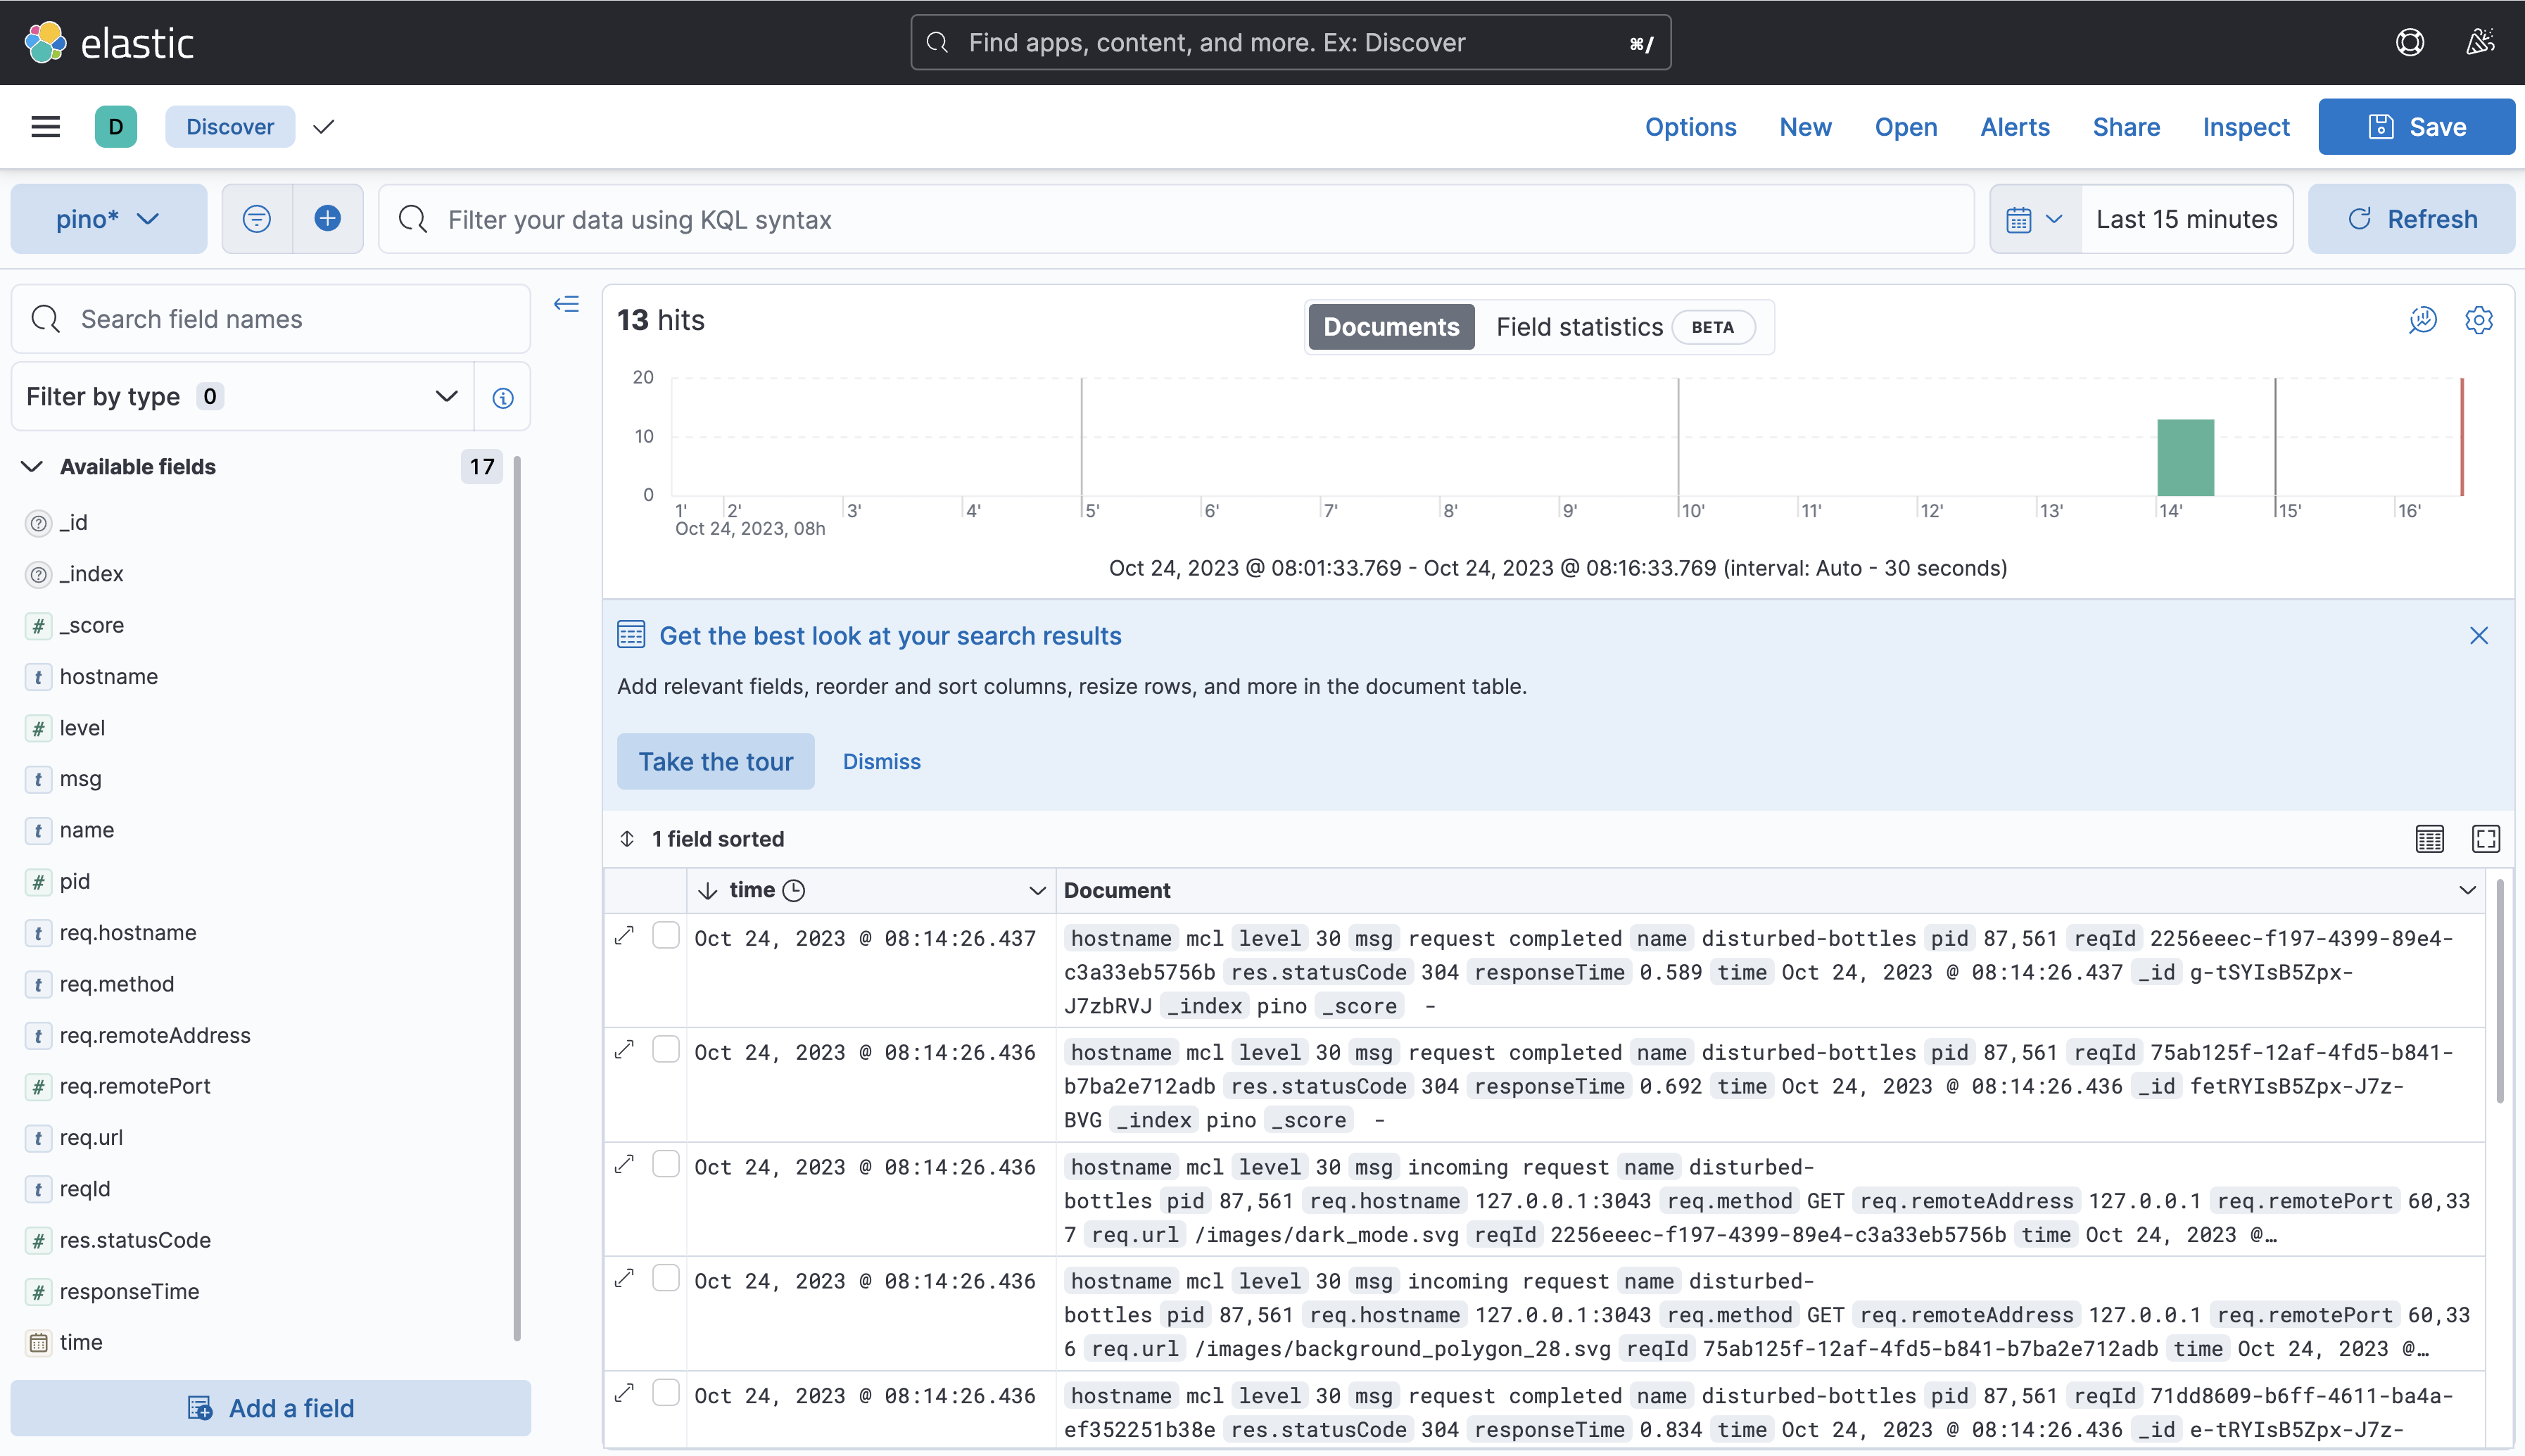
Configure Kibana
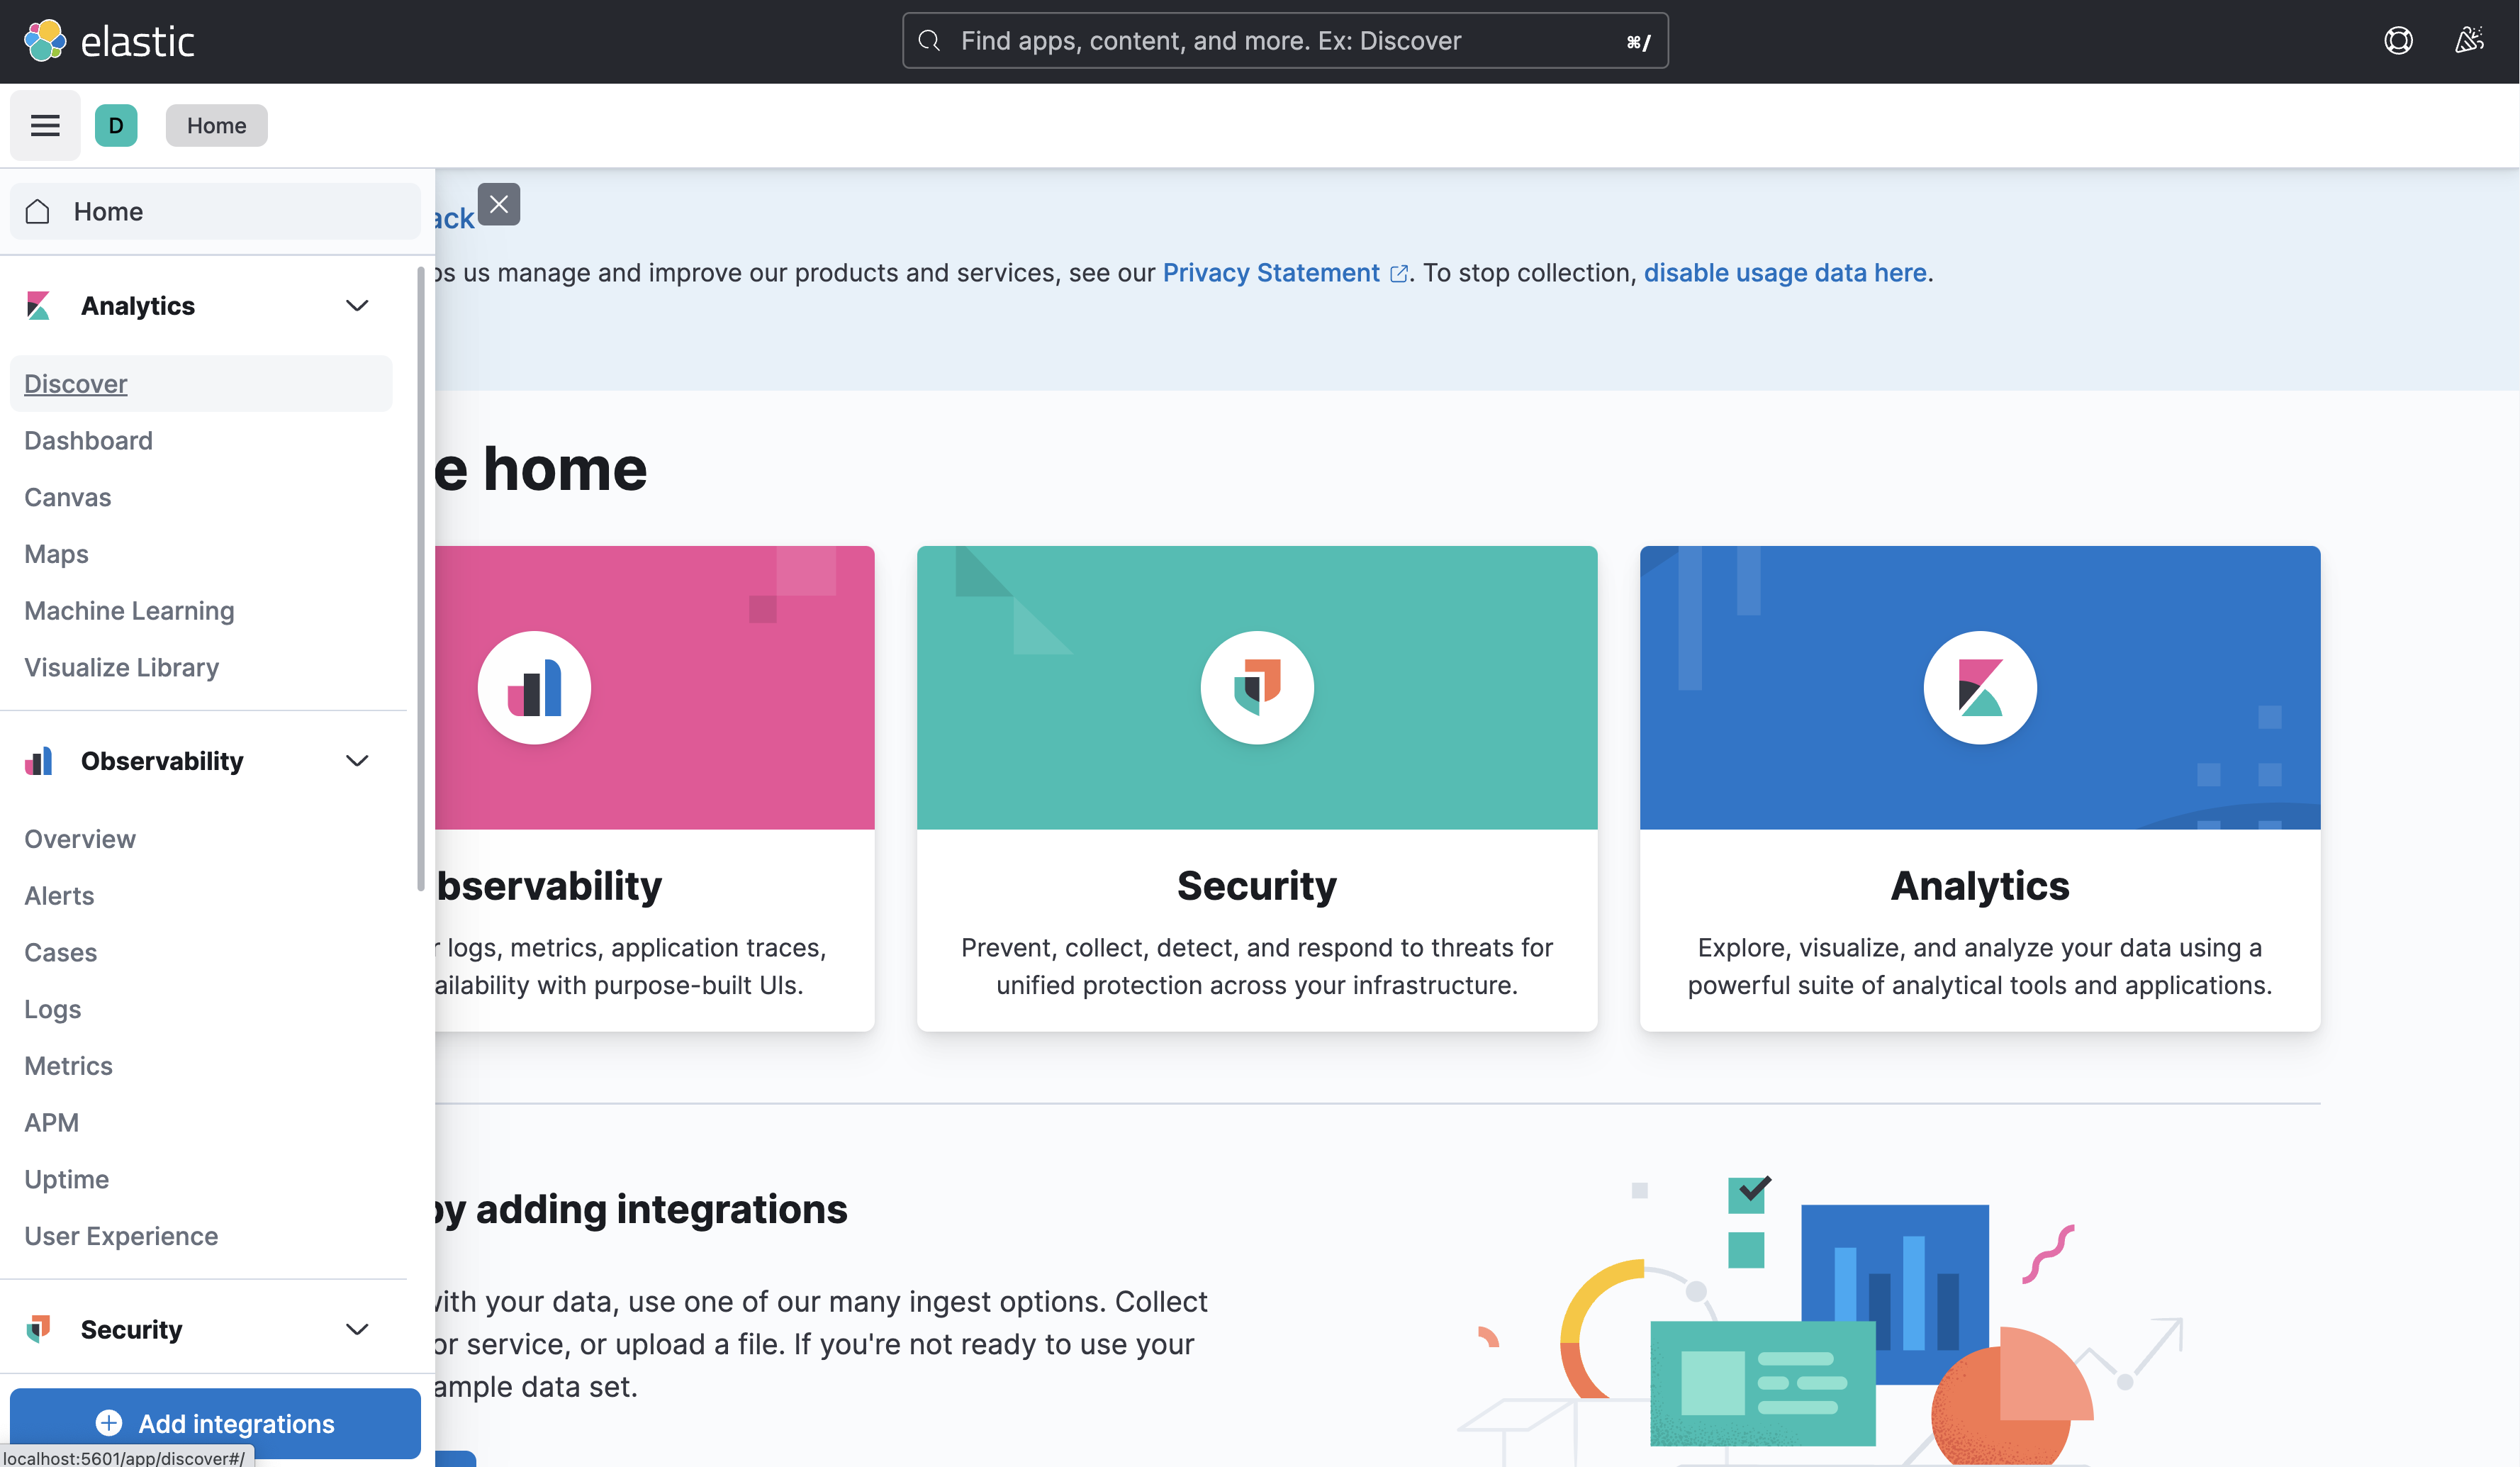
- Open
http://localhost:5601in your browser - Click on the hamburger menu on top left, and then "Discover"
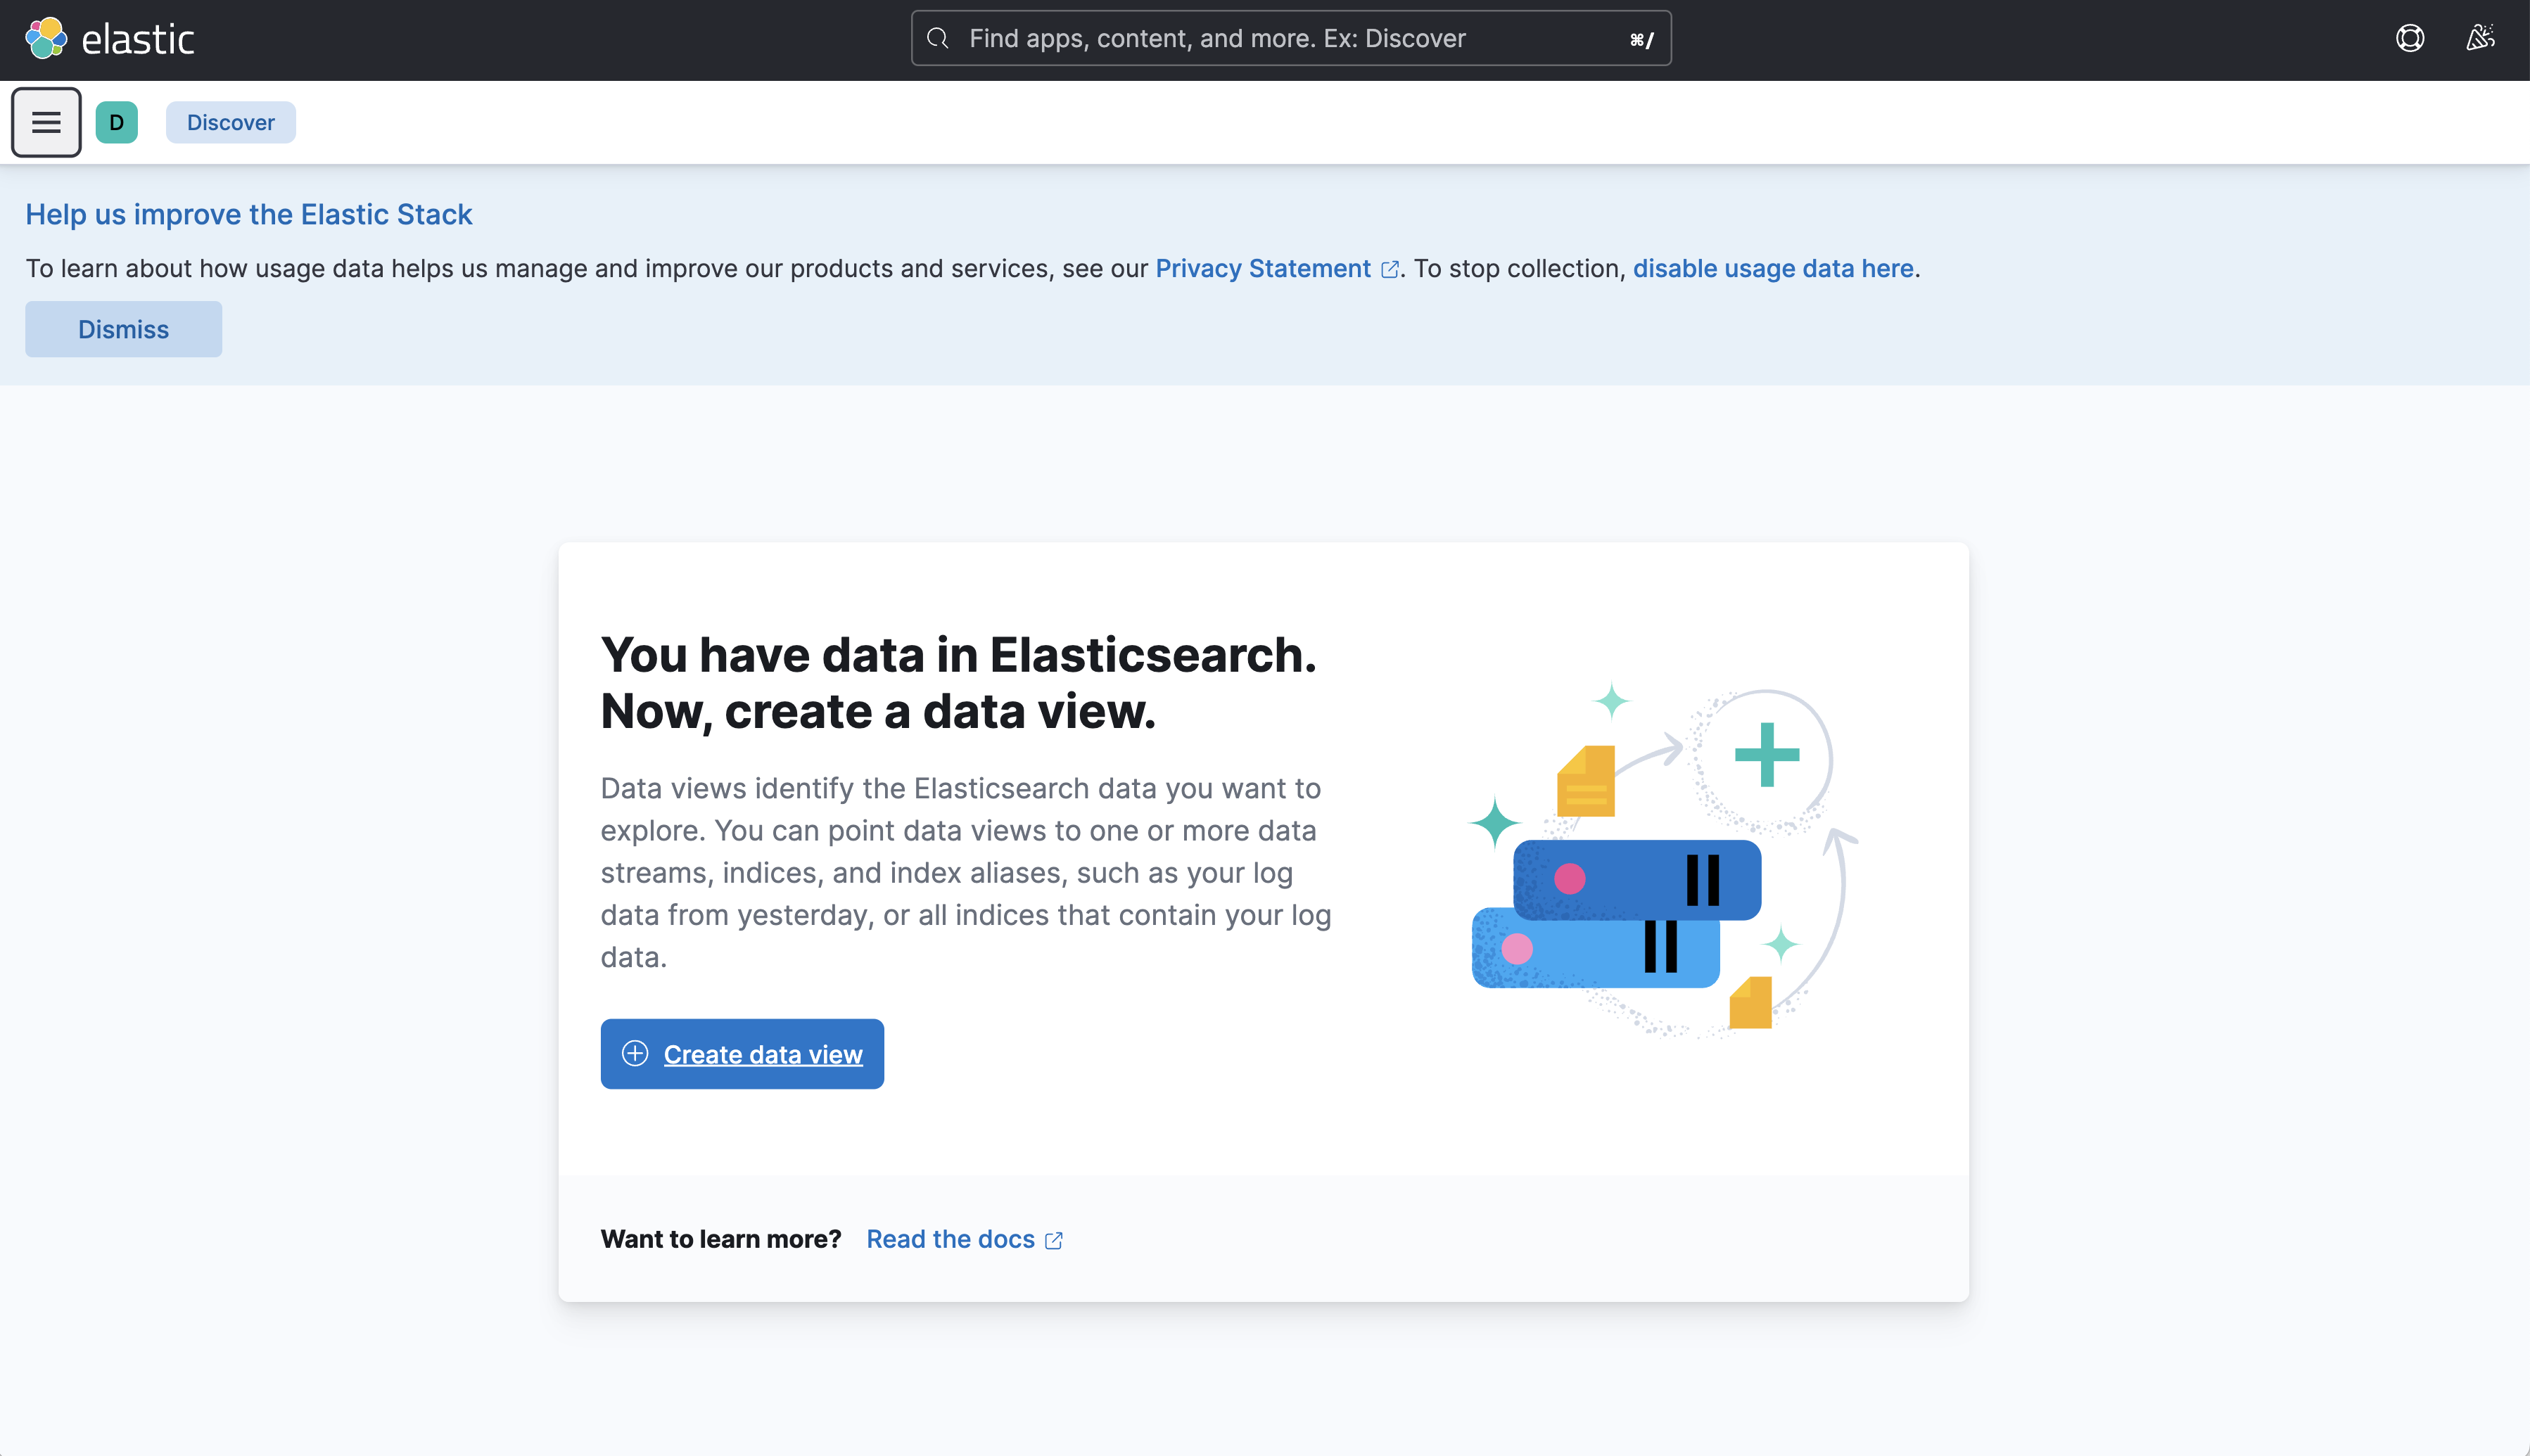
- Click on the "Create Data View"
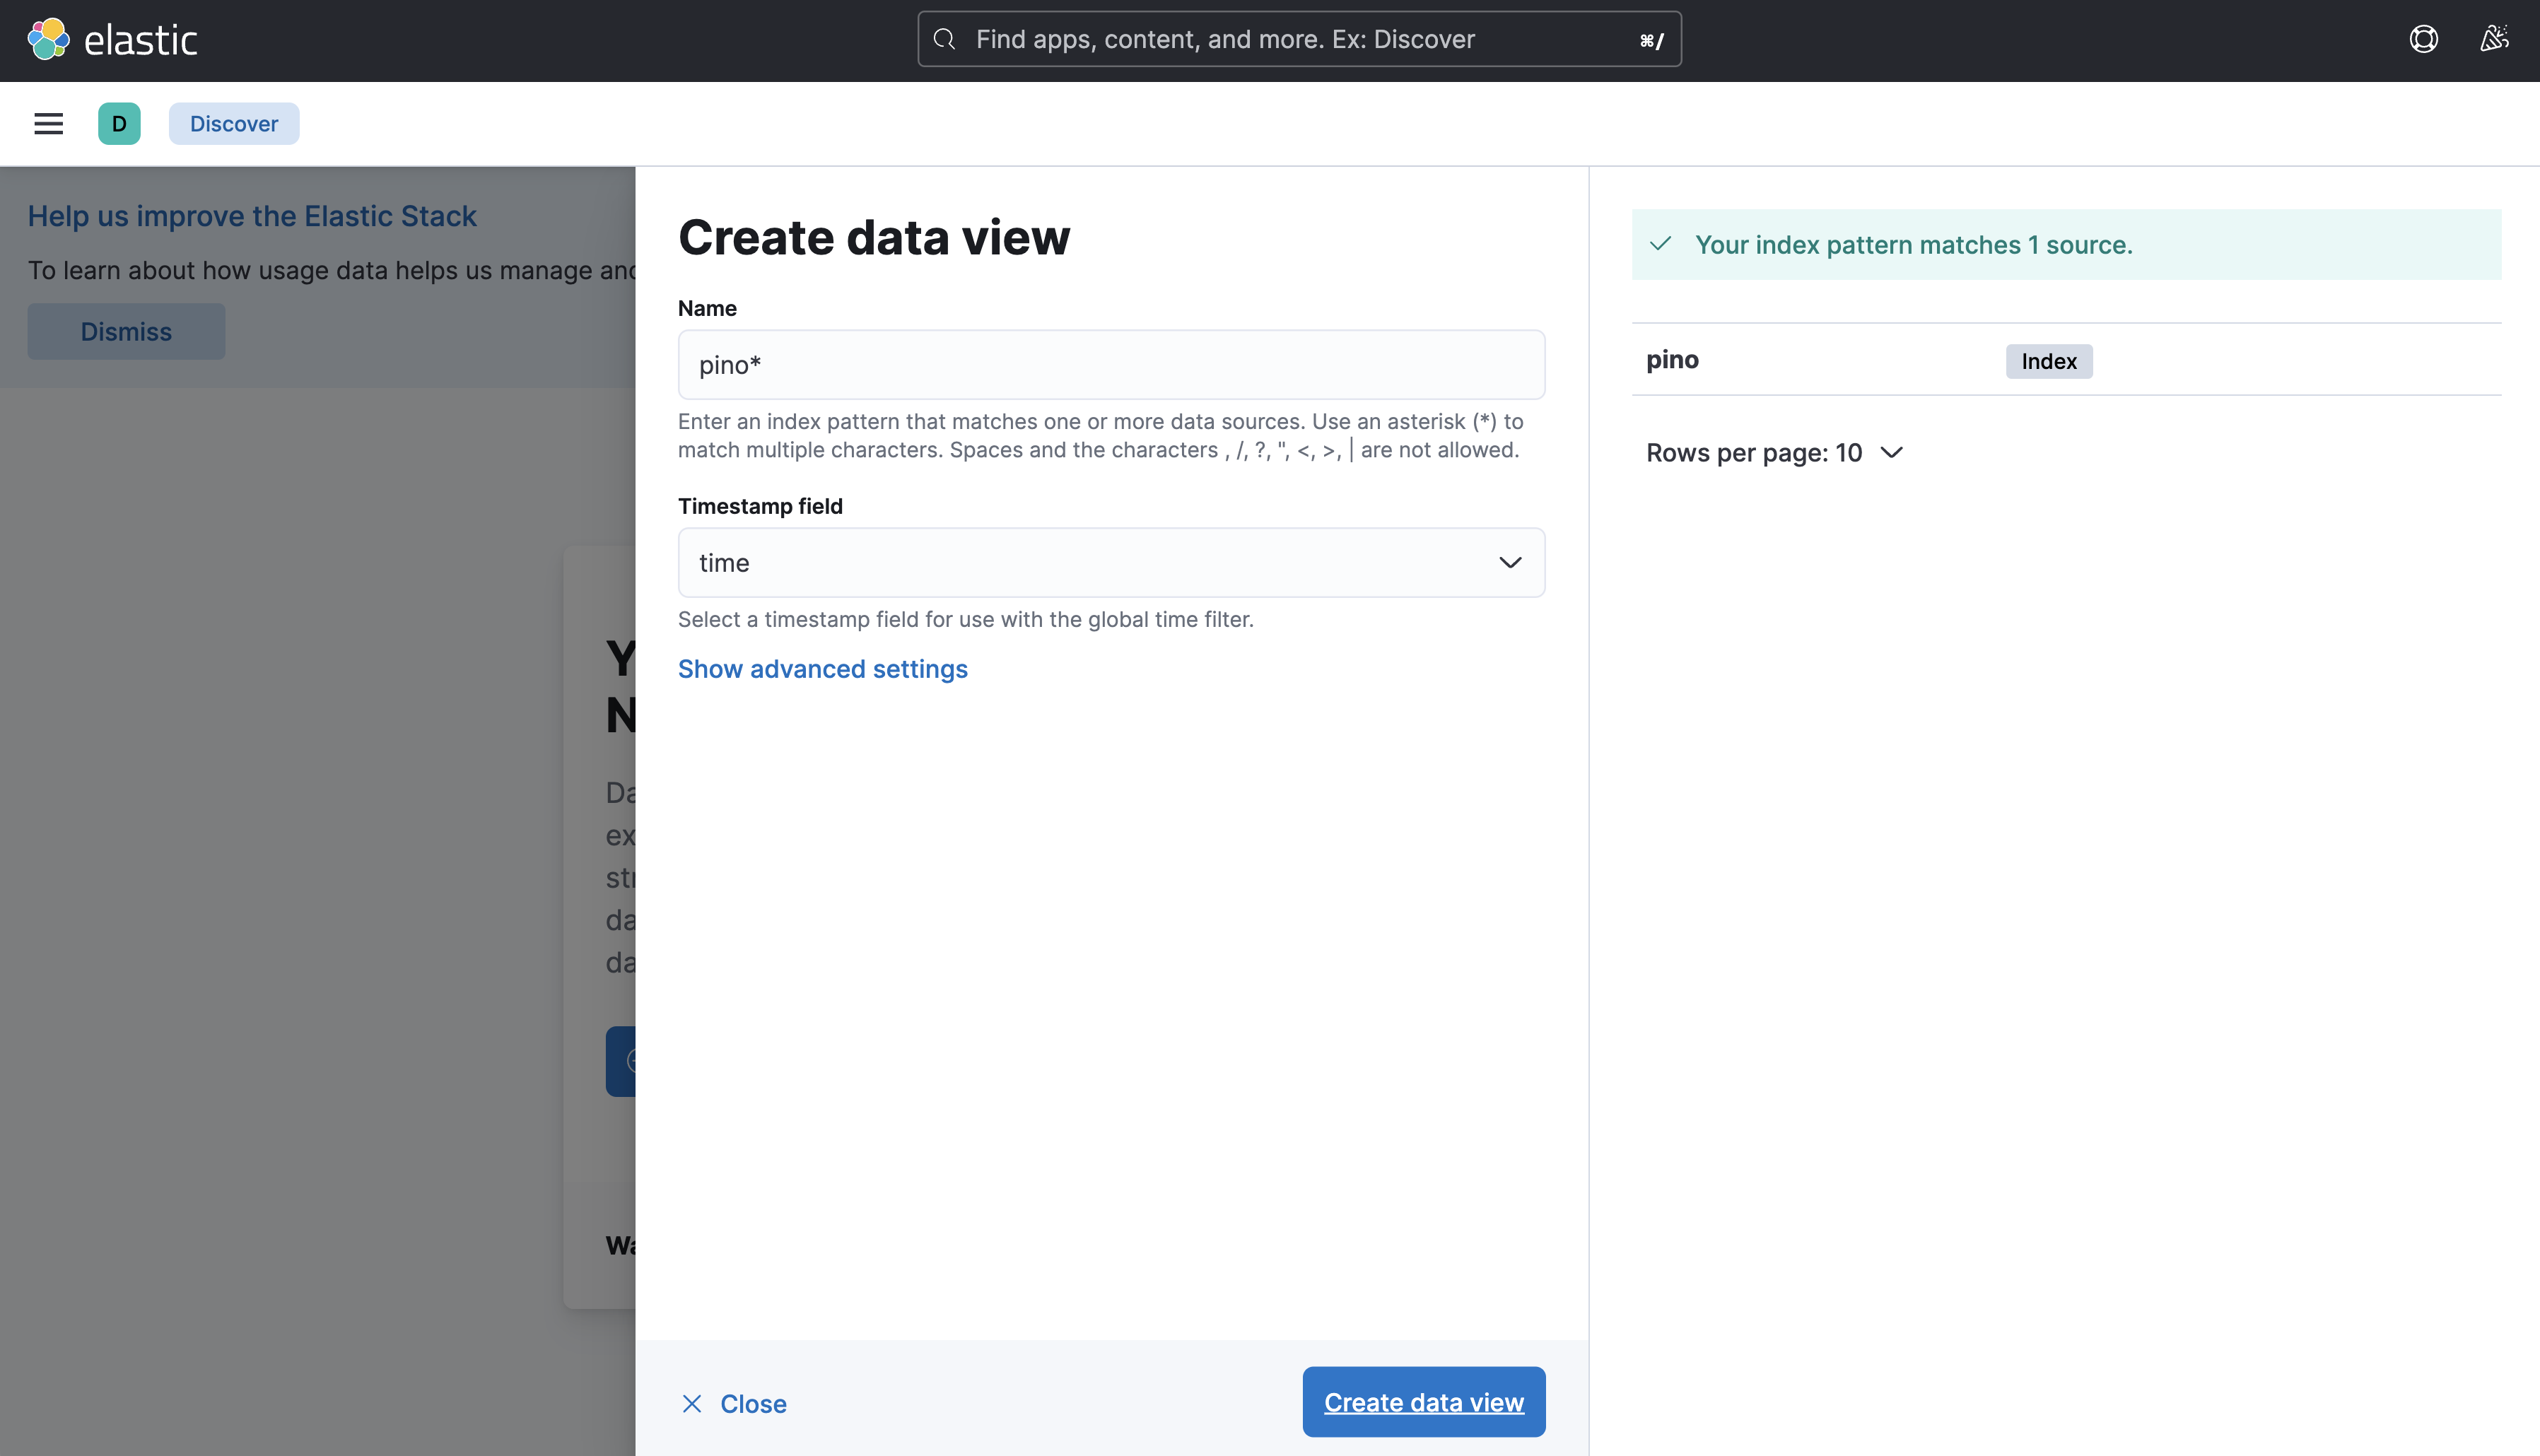
- Write
pino*asnameand selecttimeas timestamp field
- Enjoy your logs